
Experience With Numbers Behind It.
Josh shared a sales performance report spanning 2022–2025. Here's what the report's aggregate totals show.
Figures above are taken from the aggregate totals column of the sales performance report supplied by Josh. The period includes May–December 2022, full years 2023 and 2024, and 2025 year to date through May. The exact reported aggregate issued revenue is $6,522,984.50. The report's headline summary tiles appear to use a different scope; this page intentionally uses the 2022–2025 aggregate column. Figures have not been independently audited.
Results That Reflect Closing Experience.
The reported aggregate close rate is 68.61%, including no shows and cancellations, across the period shown in the source report.
This is historical sales activity from Josh's prior work, not a claim that JKL DIGITAL has already achieved these results for clients. It illustrates relevant experience, not a promised outcome.
Discuss your sales goals2,684
Leads run (aggregate)
2,515
Demos completed (aggregate)
$4,637.09
Average revenue per lead in report
See the Supplied Performance Report.
The report below is provided for context. It includes annual breakdowns, source definitions, and different summary and aggregate views.
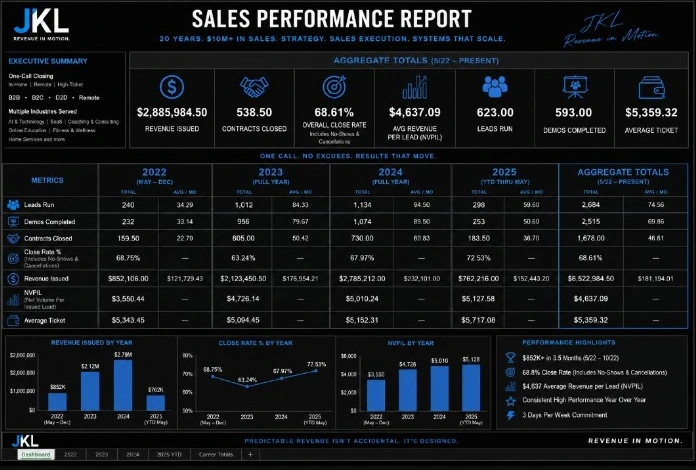
The original graphic is a screenshot supplied for this website build. Some labels in the source are small. Please verify figures against underlying sales records before distributing the report as formal evidence.
Bring a Stronger Close to Your Business.
Your process, offer, and audience are different. Start a conversation about how to strengthen what happens between interest and commitment.
Start the Conversation